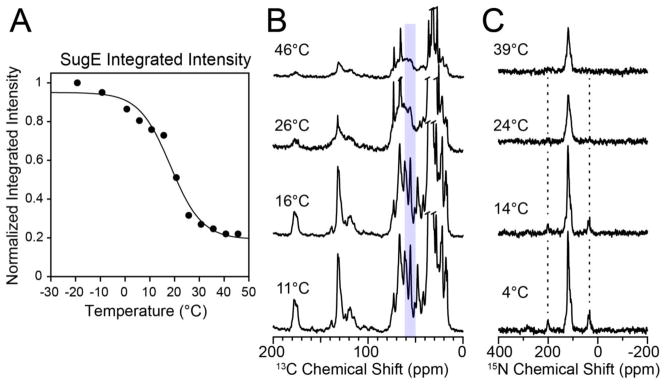
Figure 6.

MAS CP spectra and normalized intensities for the membrane transporter SugE in lipid bilayers. (A) Normalized intensity versus temperature of reverse-Ile/Leu labeled SugE in 3:1 DMPC/DMPG proteoliposomes. The black line is a sigmoidal fit of the normalized integrated intensity (the inflection point is at 18.3 °C). The intensities were obtained by integrating the 13C spectra between 50 and 61 ppm. (B) 1D 1H-13C CP spectra of SugE that were integrated in panel A. (C) 1D 1H-15N spectra of SugE at a spinning rate of 5 kHz. The spinning sidebands are visible at lower temperatures when the uniaxial rotational motion is slow and subsequently disappear as the membrane environment becomes more fluid at temperatures above the main phase transition.
