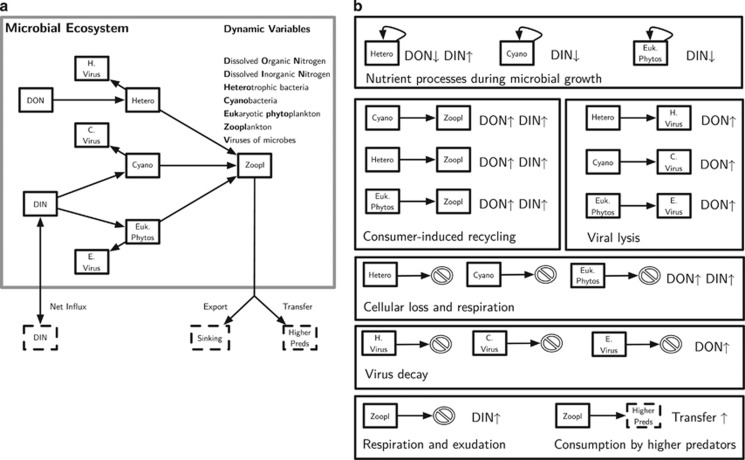
Figure 1.
Schematic of the NPHZ-V model. (a) Interactions between populations and nutrients where arrows denote the flow of materials in the system. Note that decay processes are not depicted and the secondary effects on nutrients are depicted in (b). (b) Nutrient cycling in the system. Each of the different processes affect the levels of dissolved organic nitrogen (DON) and dissolved inorganic nitrogen (DIN), where the symbols ↑ or a ↓ denote whether a given process increases or decreases that particular pool, respectively.

