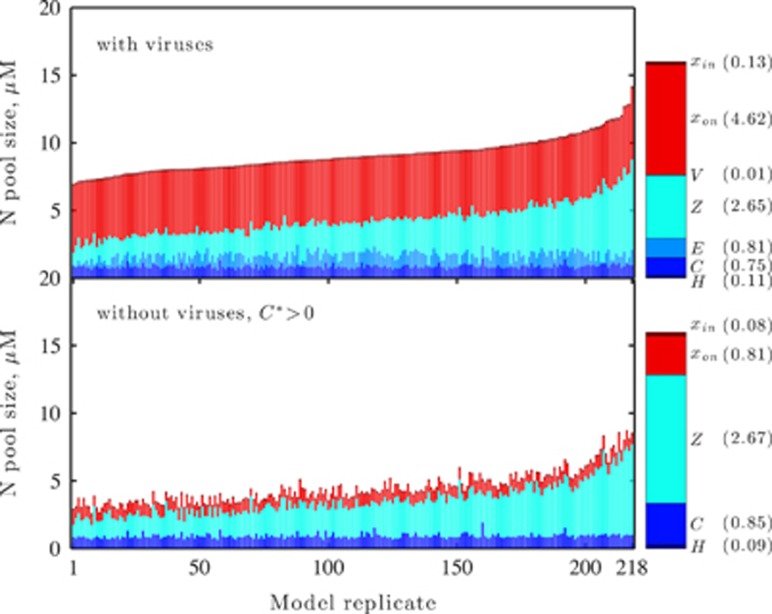
Figure 5.
Viral effects on community structure. The left panels (top and bottom) are stacked histograms of the concentration of nitrogen (N, in units of μM) partitioned in the different variables, H, C, E, Z, V (all types), xon and xin. The 218 stacked histograms correspond to each of the 218 parameter sets identified in the nonlinear optimization procedure described in the main text. The parameter sets were ordered based on the predicted total density of nitrogen (either organic or inorganic) at steady state within the specified variables. Hence, the top panel shows increasing total height. The 218 stacked histograms in the bottom-left panel show the expected average partitioning in ecosystems with the same parameters, although without viruses. The legend on the right includes information on both the color associated with each variable and the average concentration of N partitioned in that variable.

