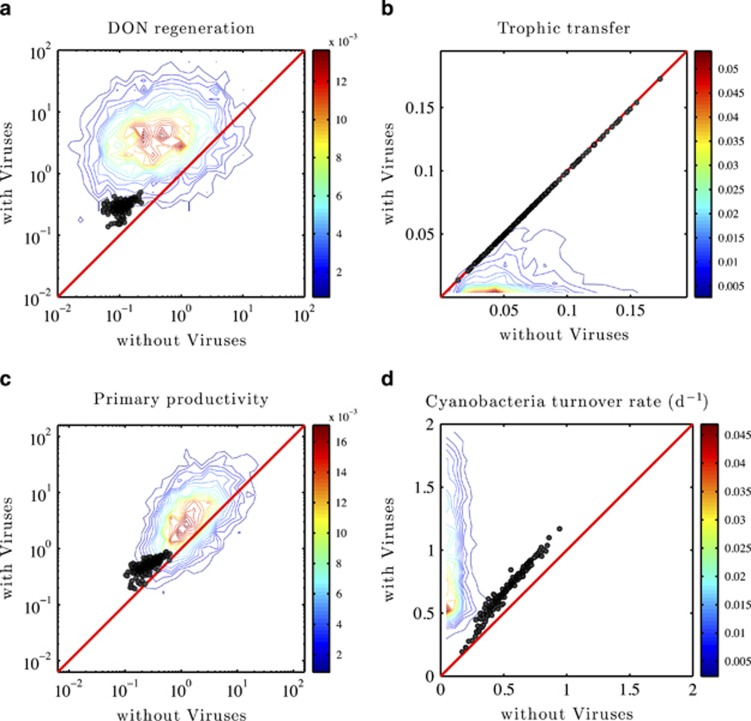
Figure 6.
Ecosystem functioning effects of viruses, including (a) DON regeneration; (b) trophic transfer; (c) primary productivity; (d) cyanobacteria turnover rate. The contour lines represent the probability distribution of pairwise comparisons for the 4366 model replicates identified by Latin hybercube sampling (LHS; see main text). The circle denote comparisons for the 218 model replicates identified as part of the targeted nonlinear optimization procedure (see main text). The red line denotes the 1:1 line and contours provide information on the relative density of observed point pairs (histograms conducted in logarithmic space for two left panels and in linear space for two right panels as input for contour analysis). All axes denoting ecosystem fluxes are in units of μmol(l days) −1, whereas the axes for cyanobacterial turnover are in units of days.

