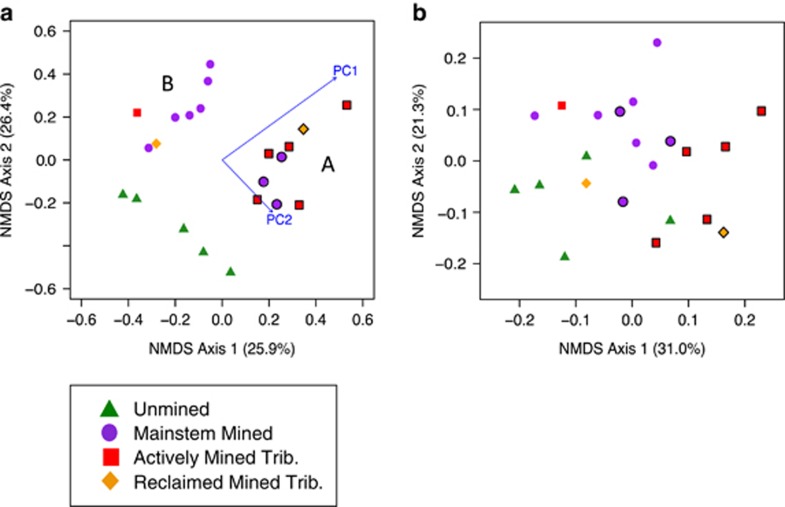
Figure 3.
NMDS ordination (a) using Bray–Curtis distance matrix and (b) using GUniFrac distance matrix (with α=0.5). Mined sites categorized as group A (symbols outlined) and group B (symbols not outlined) resulting from cluster analysis of Bray–Curtis distance NMDS. Distance matrices based on 16S rRNA pyrosequences. The r2 values are in parentheses. Stress: (a) 0.192 and (b) 0.190. Rarefied to 1543 sequences per site.

