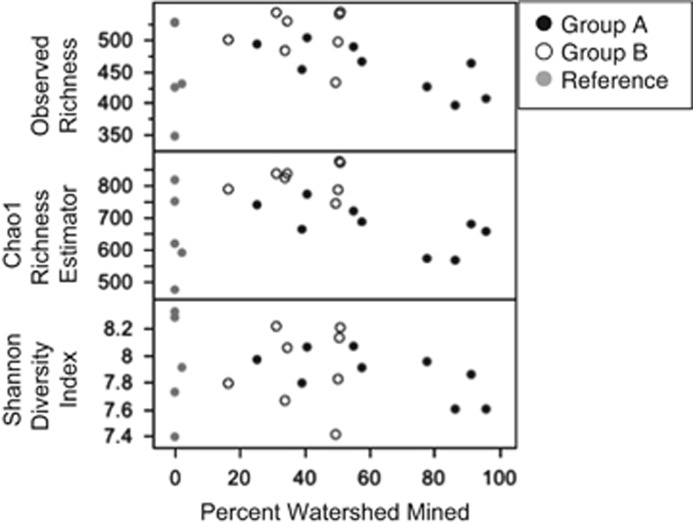
Figure 5.
The α-diversity (Chao1 richness and Shannon diversity index (H') shown here) across a range of watersheds with different percentages of their area that had been mined (Observed, P=0.44; Chao1, P=0.74; and Shannon, P=0.37). The post hoc designations of sites (group A, group B and reference) are indicated in key.

