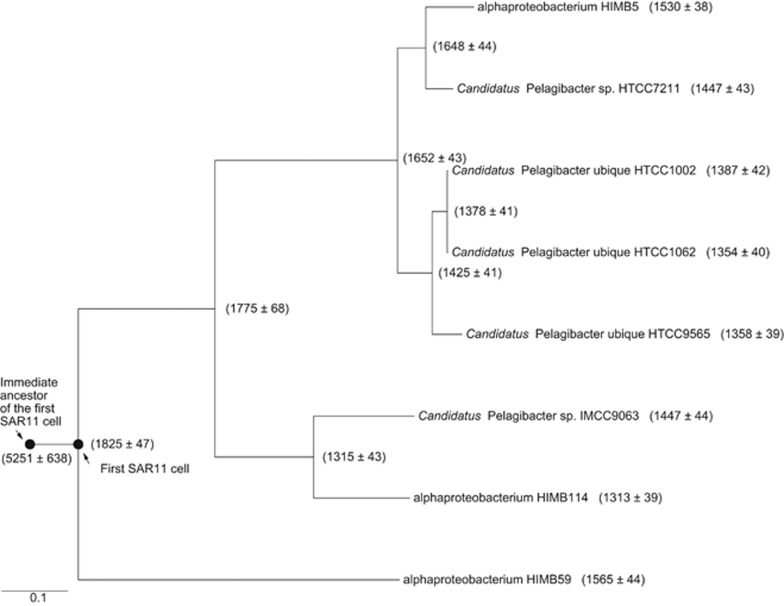
Figure 4.
Reconstructed gene numbers of each ancestral node associated with the marine SAR11 clade using the COUNT software. The standard deviation was calculated based on maximum likelihood mapping of each of 100 bootstrap data sets generated by randomly sampling the gene families (with repetitions). Closed circles represent the first SAR11 cell and its immediate ancestor.

