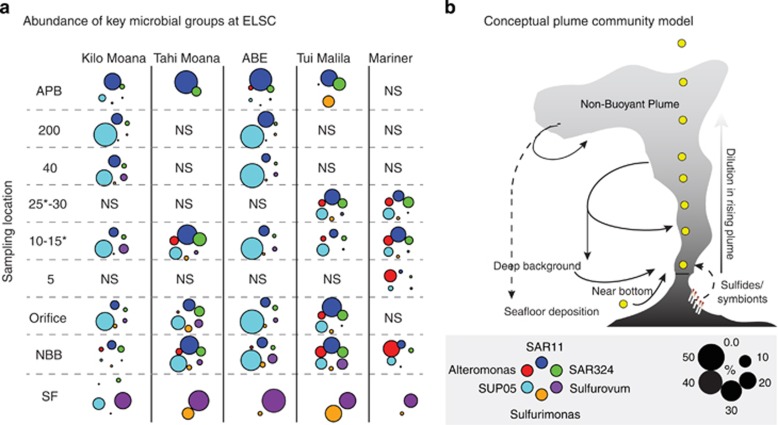
Figure 5.
(a) Abundance of dominant bacterial groups in NBB, orifice, RP (indicated by meters above orifice), and APB. Color, arrangement and size of the circles indicate the identity and abundance of the groups as shown in the legend. Note that in some cases samples from the same vent site were collected on different dives. NS indicates plume heights that were not sampled. Asterisks indicate height at which samples were taken at Mariner. (b) A conceptual model of potential sources of microorganisms within plumes. Solid and dashed arrows denote hypothesized strength of influence (solid arrows=stronger influence; dashed=weaker).

