
Figure 5.
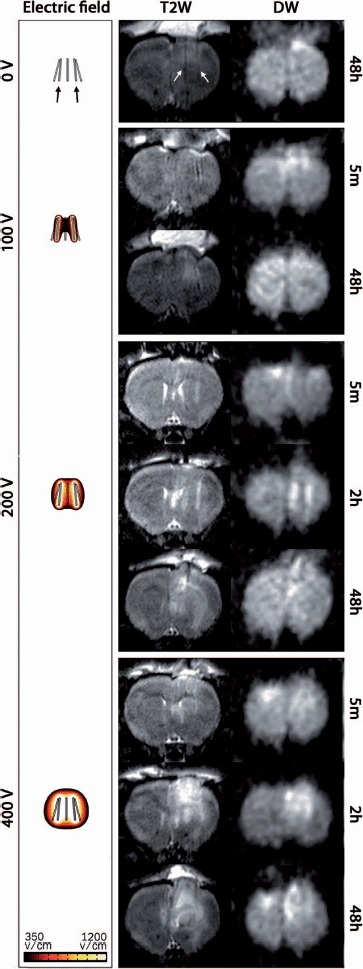
T2-weighted (T2W) and DW-MRI (b = 800) of the rat brain: Representative coronal MRI scans at selected time points and all voltage levels. In the DW-MRI images the hyper-intensity reflects low diffusivity and hypo-intense regions reflect high diffusivity. The left column shows the calculated electric field distributions in the range 350–1200 V/cm. White arrows in the top panel (T2W) indicate the tracks left by the electrodes (black arrows).