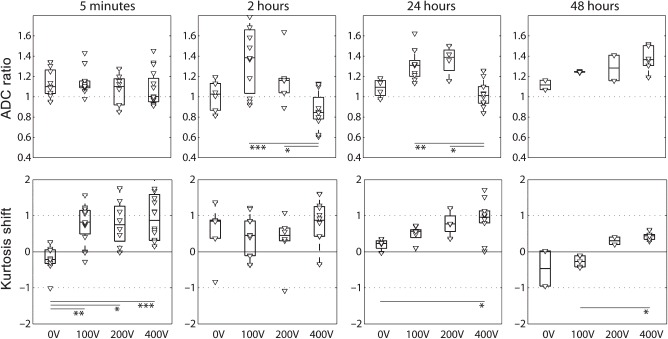
Figure 6.

ADC ratios and kurtosis shift over time: The ADC ratio is the median ADC of the electroporated region over the median ADC of the control region. The kurtosis shift is the median kurtosis of the electroporated region minus the median kurtosis of the control region (kurtosis shift). (Variance of measurements of the control and electroporated region was comparable). Electroporated region and control region definitions are shown in Figure 3. All data points are shown individually and as boxes with the central mark indicating the median. The edges of the box are the 25th and 75th percentiles. Significance levels: ∗p < 0.05, ∗∗p < 0.01, ∗∗∗p < 0.001.
