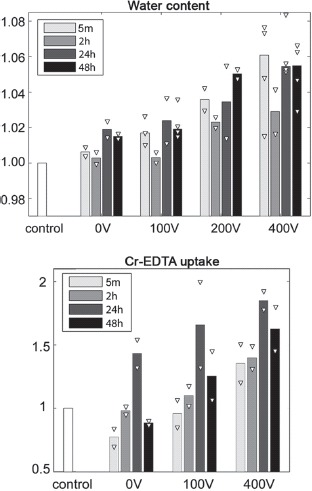
Figure 7.

Water content: The water content of the electroporated region (right hemisphere) divided by the water content of the control region (left hemisphere). Extracellular volume (ECV): The change in 51Cr-EDTA uptake as counts per unit tissue weight of the electroporated region over counts per unit tissue weight of the control region. Bars show median values and white triangles indicate individual data points (2–4 observations per group).
