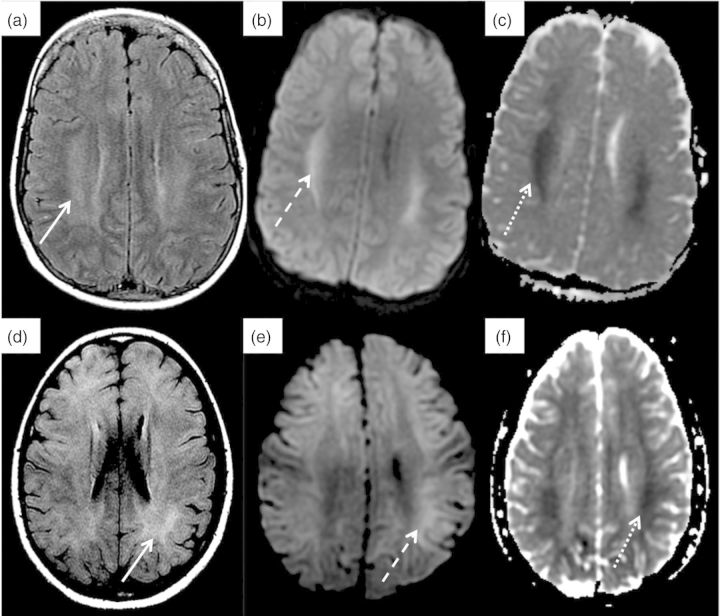
Fig. 3.
Head MRI findings in two patients with DDS. Patients 1 (a–c) and 2 (d–f): (a and d) axial fluid attenuated inversion recovery shows abnormal signal (vasogenic edema) within the white matter (solid arrow). (b and e) T2-weighted trace showing cytotoxic edema within the white matter (dashed arrow). (c and f) apparent diffusion coefficient mapping showing cytotoxic edema within the white matter (dotted arrow).

