
Fig. 3.
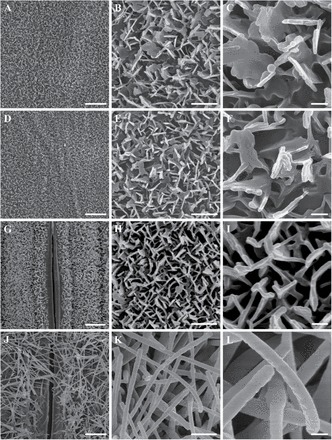
SEM analysis of the wax crystals on the leaf surface of wheat cv Xinong 2718 at the seedling stage and flowering stage. (A–C) The adaxial sides of leaf blades at the seedling stage. (D–F) The abaxial sides of leaf blades at the seedling stage. (G–I) The adaxial sides of leaf blades at the flowering stage. (J–L) The abaxial sides of leaf blades at the flowering stage. A, D, G and J were detected by SEM at ×2000 magnification. B, E, H and K were detected by SEM at ×10 000 magnification. C, F, I and L were detected by SEM at ×30 000 magnification. Scale bars=4 μm (A, D, G, and J), 1 μm (B, E, H, and K), 0.2 μm (C, F, I, and L).