Fig. 7.

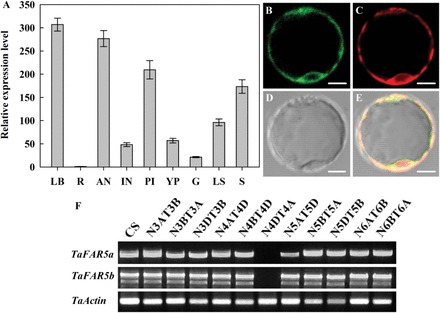
Expression analysis of TaFAR5 and subcellular localization of the TaFAR5 protein. (A) Quantitative RT-PCR analysis showing the expression of TaFAR5. LB, young leaf blades; LS, leaf sheaths; R, roots; IN, internodes; YP, young panicles; AN, anthers; PI, pistils; G, glumes; S, seeds. Wheat TaActin was used as reference. Error bars indicate the SE of three independent samples. (B–E) Subcellular localization of TaFAR5 in the rice protoplast. (B) GFP fluorescence of the protoplast cell expressing 35S:TaFAR5–GFP. (C) ER marker mCherry–HDEL. (D) Bright-field image of the protoplast cell. (E) A merged image of B, C, and D. Scale bars=5 μm. (F) Chromosomal localization of TaFAR5. RT-PCR was performed on 11 nullisomic–etrasomic (N-T) lines of wheat cultivar Chinese Spring with two pairs of primers, TaFAR5a and TaFAR5b, which specifically amplify different chromosomal assignment of TaFAR5, respectively. (This figure is available in colour at JXB online.)
