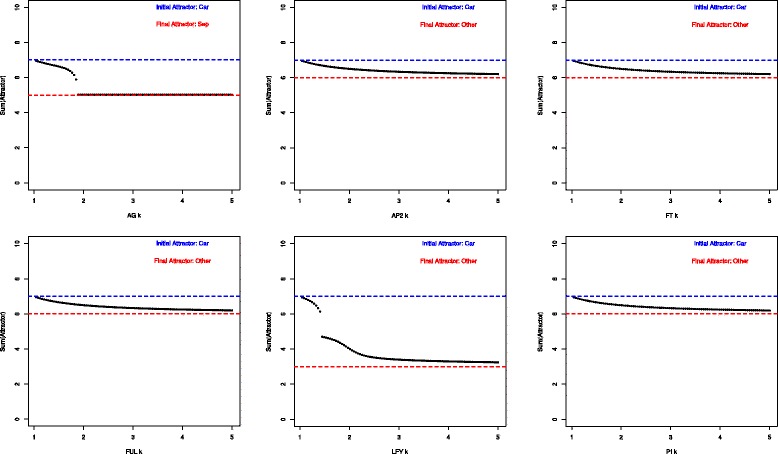
Figure 2.

Bifurcation diagrams. Graphs obtained as a result of the Bifurcation analysis performed for the genes corresponding to carpels (Car) attractor. The genes AG and LFY were able to induce qualitative changes. The gene AG produced a transition between already characterized attractor states (Car → Sep). The change in LFY produced a new attractor state.
