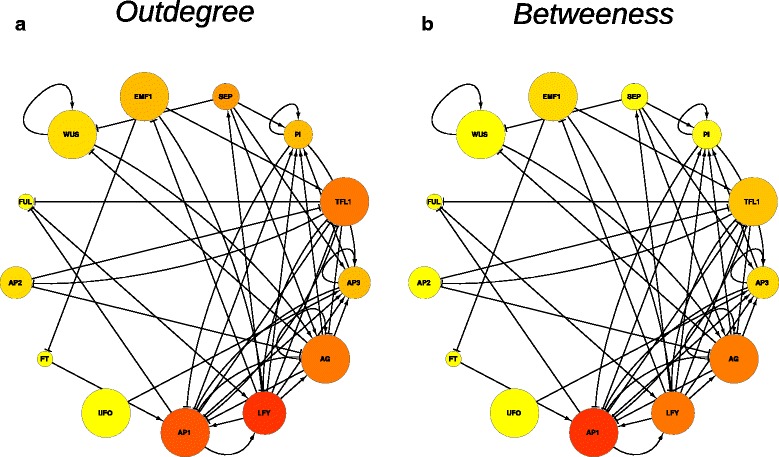
Figure 4.

The FOS Gene regulatory network. The graph represents the mapping of the calculated PT values with the topological features out-degree (a) and betweenness (b) into the graph of the FOS-GRN. The size of the nodes represents the PT values. The topological features are represented by a graded yellow-red color scale with yellow (red) in the left (right) extreme.
