Fig. 2.

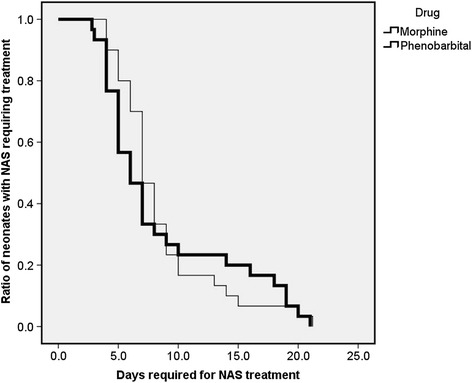
Kaplan-Meier curve showing the effect of Morphine (thin line) versus Phenobarbital (thick line) treatment on the duration of treatment required for the resolution of NAS

Kaplan-Meier curve showing the effect of Morphine (thin line) versus Phenobarbital (thick line) treatment on the duration of treatment required for the resolution of NAS