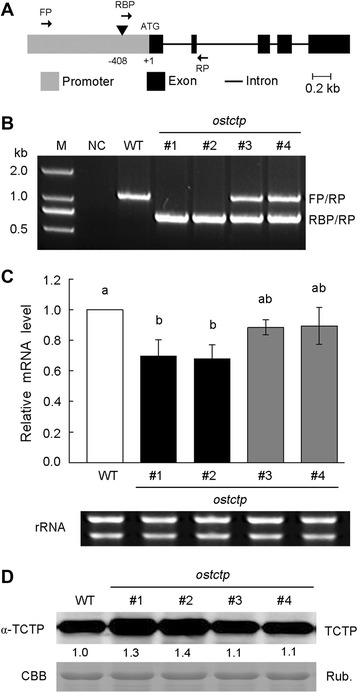
Figure 4.

OsTCTP expression patterns in ostctp mutant plants. (A) Gene structure of OsTCTP. Gray box is the promoter region; Block boxes indicate exons in coding region; lines connecting boxes are introns. Triangles are T-DNA insertions of ostctp. Arrows FP, RP, and RBP are primers used for genotyping ostctp. (B) PCR analysis of genotyping of mutant ostctp. FP, RP, and RBP are primers used for genotyping ostctp. (C) qRT-PCR analysis of OsTCTP mRNA level in mutant ostctp. Histone H3 was used as an internal standard and data are given as means ± SD of three biological replicates. Means with different letters are significantly different (P < 0.05, Tukey’s test). (D) Western blot analysis of OsTCTP protein from mutant ostctp using an antibody against rice OsTCTP. Equal amounts (20 μg) were loaded to each lane and were confirmed by coomassie brilliant blue (CBB) staining of Rubisco (bottom). The experiments were repeated for three times with similar results. Quantitative assessment was processed by Quantity One® Software (http://www.bio-rad.com).
