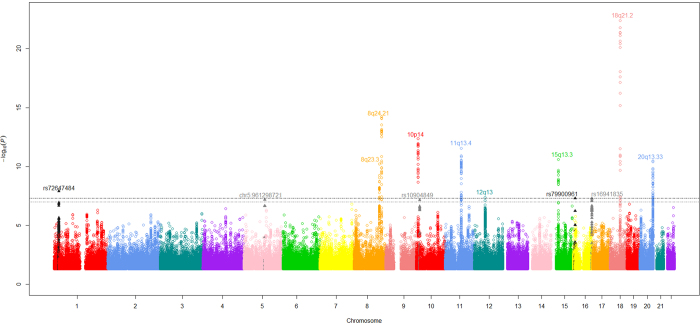
Figure 1. Genome-wide P-values (–log10P, y-axis) plotted against their respective chromosomal positions (x-axis).
Known regions attaining genome-wide significance (i.e. P = 5.0 × 10⁻⁸) are labelled with their chromosomal location. Variants in grey lie in novel regions that reach the significance threshold level (P = 1.0 × 10⁻⁷) required for variants to be analysed further in this study. Variants in black lie in novel regions attaining genome-wide significance.

