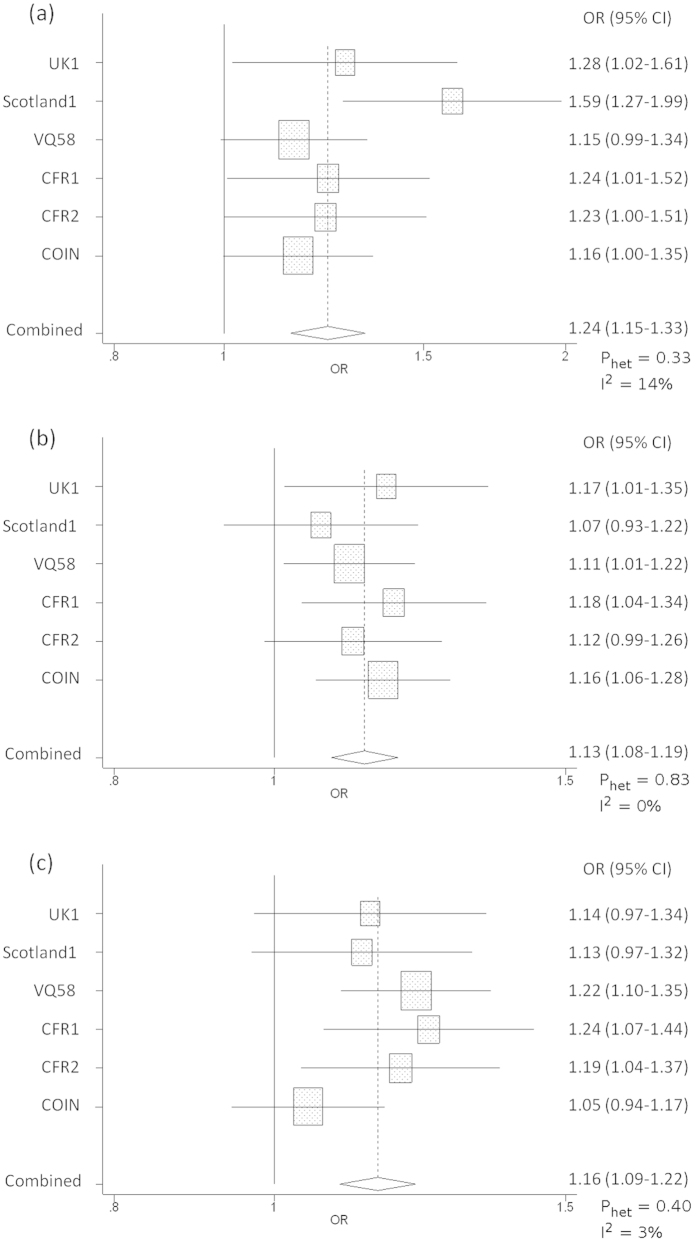
Figure 2. Forest plot of the odds ratios for the association between rs72647484, rs16941835, rs10904849 and CRC.
Studies were weighted according to the inverse of the variance of the log of the OR calculated by unconditional logistic regression. Horizontal lines: 95% confidence intervals (95% CI). Box: OR point estimate; its area is proportional to the weight of the study. Diamond (and broken line): overall summary estimate, with confidence interval given by its width. Unbroken vertical line: null value (OR = 1.0).

