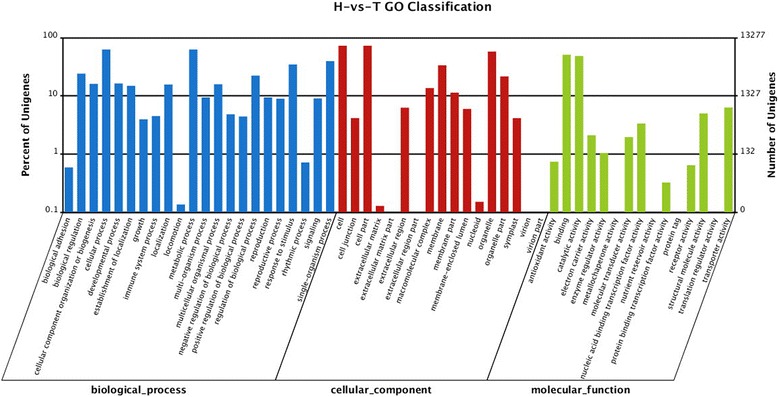
Figure 3.

Ontology classification of DEGs in the TPD-affected (T) bark compared to the healthy (H) bark of rubber tree. “H-vs-T” means H is control and T is treated. Distribution of expressed genes in H compared to H with the categories of biological process, cellular components and molecular function. The Y-axis on the right side indicates the percent of genes in a category, and the y-axis on the left means the number of genes.
