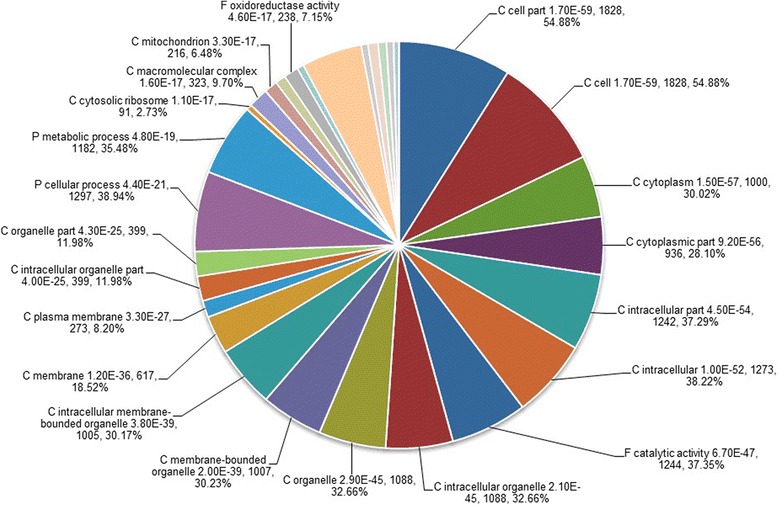
Figure 4.

Gene ontology annotation of down-regulated genes in the TPD-affected (T) bark compared to the healthy (H) bark of rubber tree. P: the biological process; C: the cellular component; F: the molecular function. The P value, the number of genes and the percentage of genes in the corresponding categories were given after the name of subcategories.
