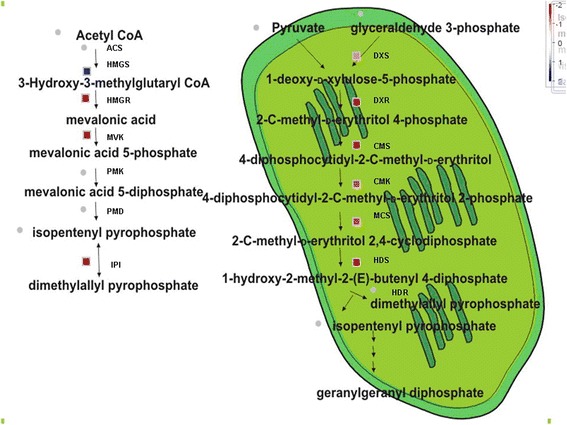
Figure 6.

Differential expression of transcripts involved in MVA pathway (left) and MEP pathway (right) across the transcriptome of the TPD affected rubber trees. Color bar represents the levels of transcript abundance. The depth of the red and the blue indicates the levels of the down-regulated expression and the up-regulated expression of the genes, respectively.
