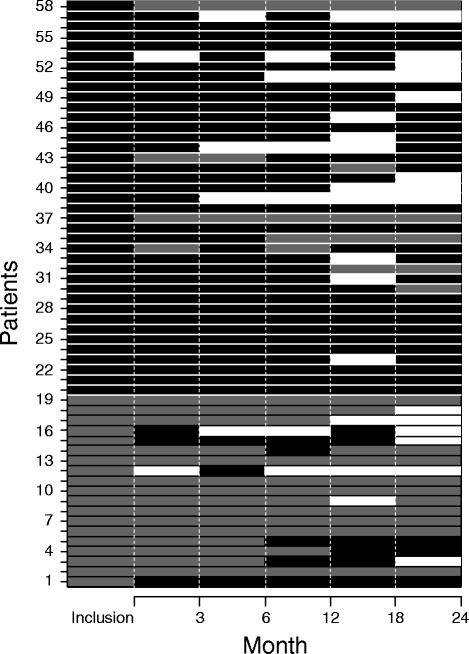
Figure 2.

Detailed changes in the smoking statuses of the patients during the study. The patients’ smoking statuses were recorded at each scheduled visit based on their self-reports and urinary cotinine concentrations (except in patients using nicotine replacement therapy). Each line represents a patient. Periods of current smoking are displayed in black, periods of smoking cessation in grey, and periods of loss to follow-up in white.
