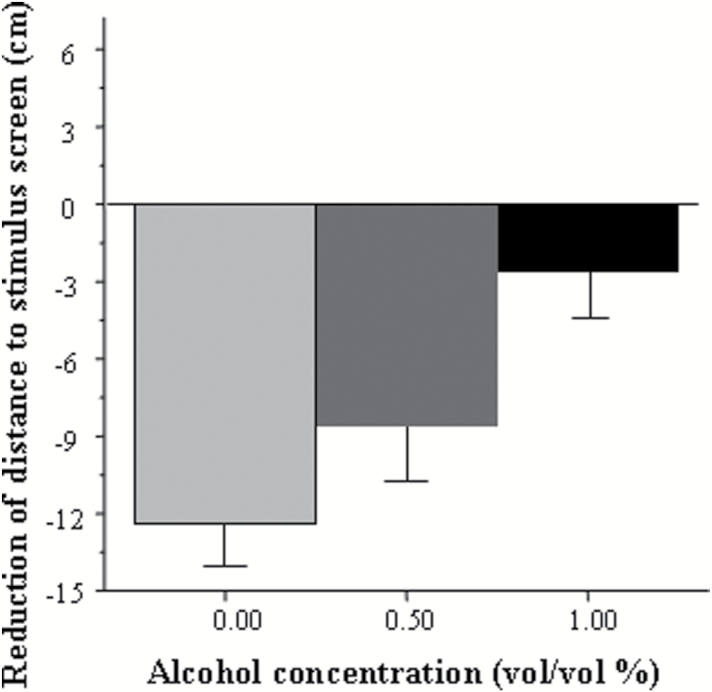
Figure 2.
Reduction of distance between the adult experimental zebrafish and the stimulus screen in response to conspecific stimulus presentation. Mean ± SEM are shown. Sample sizes are given in the Methods section. Values represent the difference between the distances fish were from the stimulus presentation screen before and during conspecific stimulus presentation. Larger negative values mean larger reduction of distance, that is, stronger response to the conspecifics. The categories indicated for the x-axis represent the embryonic alcohol dose (vol/vol % bath concentration) administered at the 24th hour postfertilization for a 2-hour duration. Note the linear negative dose response relationship between the alcohol dose and the shoaling response.

