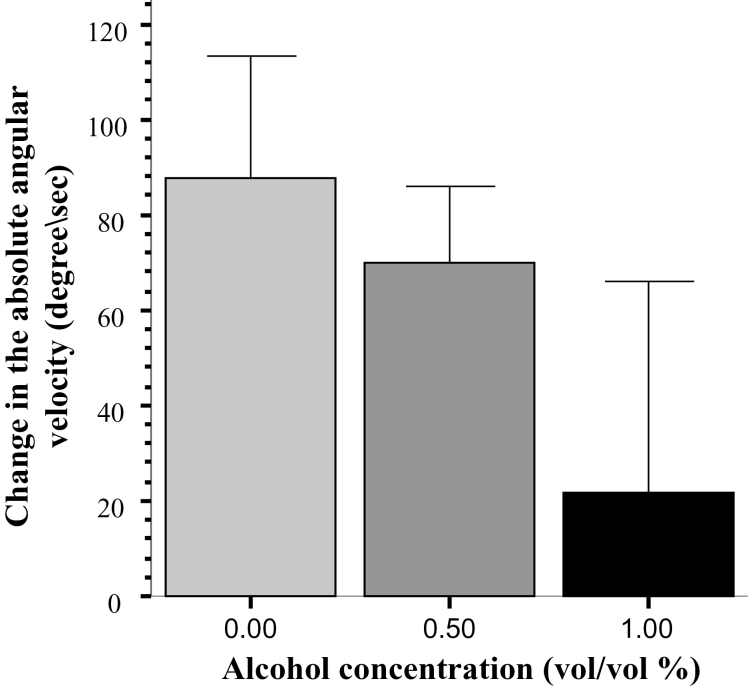
Figure 4.
Change of the absolute angular velocity upon the presentation of the animated shoal. Mean ± SEM are shown. Sample sizes are given in the Methods section. The concentration of alcohol treatment (one exposure for 2 hours, 24 hours postfertilization) is shown under the x-axis. Note that no significant differences were found among the treatment groups.

