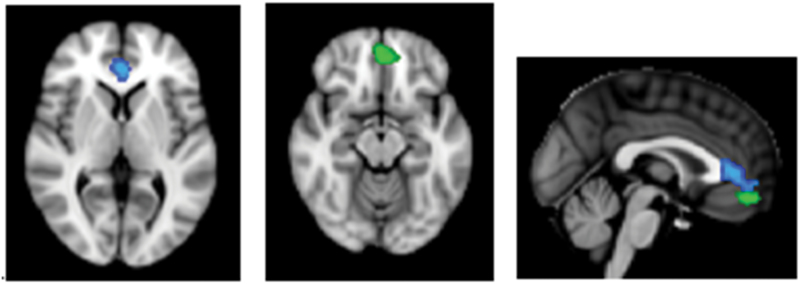
Figure 5.
Axial and sagittal views displaying the regions with a significant relationship between emotional intelligence and BA25 functional connectivity. Green indicates the BA10r cluster. There was a significant group difference in the relationship between Strategic Emotional Intelligence and BA25 functional connectivity (FC) in a BA10r cluster. Cluster size = 208 voxels, peak value at x = -2, y = 46, z = -14 MNI, p = 0.01. Blue indicates the BA24 cluster. There was a significant relationship between Experiential Emotional Intelligence and BA25 FC in a BA24 cluster in the whole sample. Cluster size = 460 voxels, peak value at x = 0, y = 38, z = 4 MNI space, p = 0.016. BA, Brodmann areas.

