Figure 4.

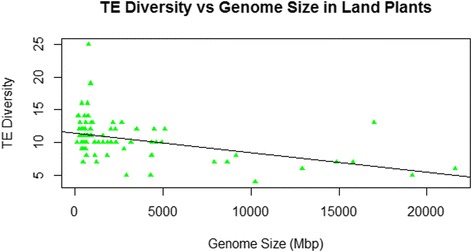
Number of superfamilies (TE diversity) and genome size (Mbp) in 80 land plant genomes. The line represents the significant negative correlation between TE diversity and genome size among plants (r = −0.44, p < 0.0001).

Number of superfamilies (TE diversity) and genome size (Mbp) in 80 land plant genomes. The line represents the significant negative correlation between TE diversity and genome size among plants (r = −0.44, p < 0.0001).