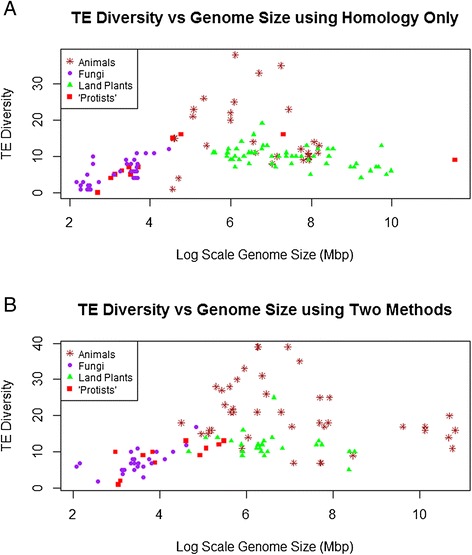
Figure 6.

Effects of TE discovery method. The overall pattern of TE diversity versus genome size among eukaryotes according to whether TE discovery was A) based only on sequence similarity against an existing database or B) based on both sequence similarity and de novo discovery. (A much smaller number of studies used only de novo methods, and are not shown in a separate analysis). Importantly, the general patterns are the same regardless of TE discovery method(s) used (see also Figure 1). Brown points represent animal genomes, green points represent land plant genomes, purple points represent fungal genomes and red points represent “protist” genomes.
