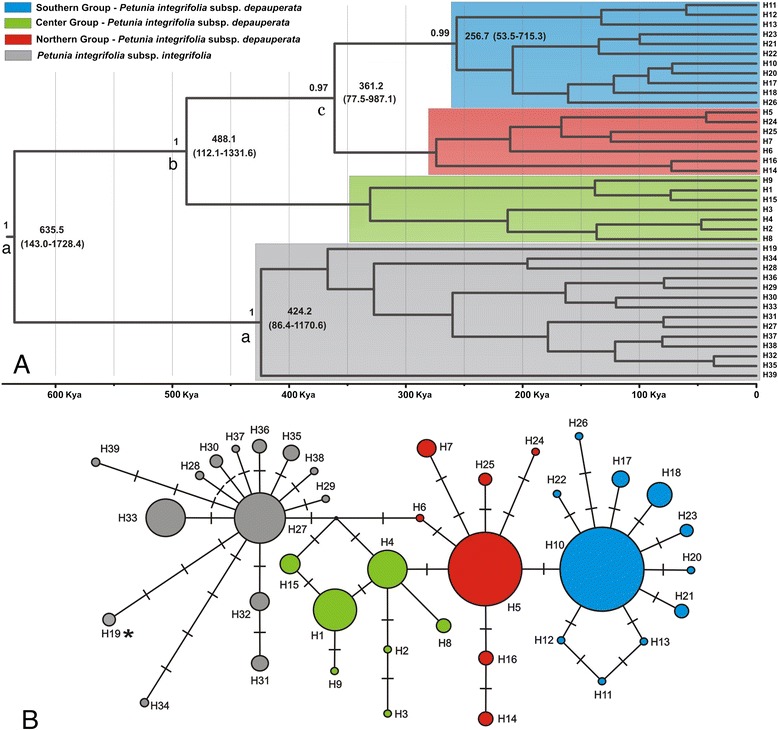
Figure 2.

Evolutionary relationships among haplotypes of Petunia integrifolia subspecies. (A) Bayesian phylogenetic tree with posterior probabilities (PP > 0.9) shown above the branches and ages indicated below branches for selected nodes in thousands of years (Kya). Confidence intervals are presented in parenthesis; selected nodes marked with “a” indicate the higher probability of Most Recent Common Ancestor origin in Petunia integrifolia ssp. integrifolia group and “b” and “c” indicate Center and Southern Groups of Petunia integrifolia ssp. depauperata, respectively (see Table xx for probabilities); (B) Haplotype median-joining network. Sizes of the circles are proportional to the overall frequency of the haplotypes, and the color within each circle represents different genetic groups, according to the colors on the left and the Bayesian inference. Crossed lines represent inferred differences between haplotypes. The haplotype marked by asterisk (H19) belongs to Petunia integrifolia spp. depauperata population 17 (more details in the main text).
