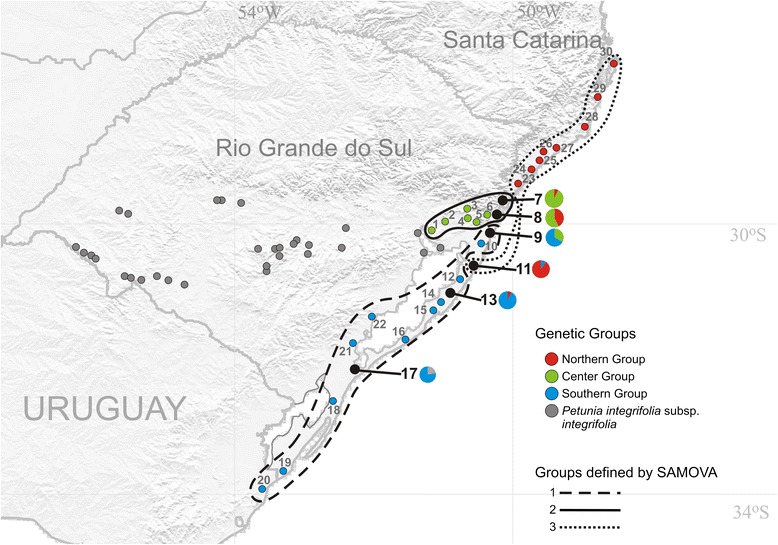
Figure 3.

Geographical groups identified by SAMOVA analyses. Each group is indicated by a border style. The colors displayed in the populations correspond to genetic groups found in the phylogeny and the median-joining haplotype network. The gray dots indicate Petunia integrifolia ssp. integrifolia populations. The black dots highlighted with larger fonts are the populations with haplotypes from different genetic groups. Lines represent SAMOVA groups according the legend.
