Figure 4.

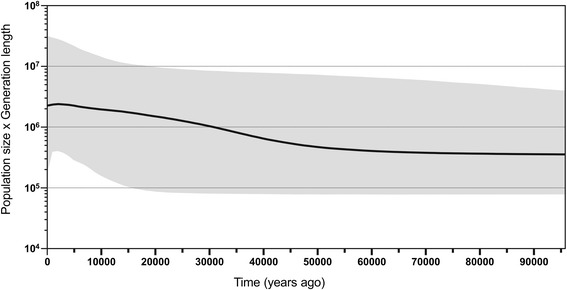
Historical changes in the effective size. Bayesian skyline plot showing the effective population size fluctuation throughout time for Petunia integrifolia ssp. depauperata (solid line, median estimations; grey area, confidence interval).

Historical changes in the effective size. Bayesian skyline plot showing the effective population size fluctuation throughout time for Petunia integrifolia ssp. depauperata (solid line, median estimations; grey area, confidence interval).