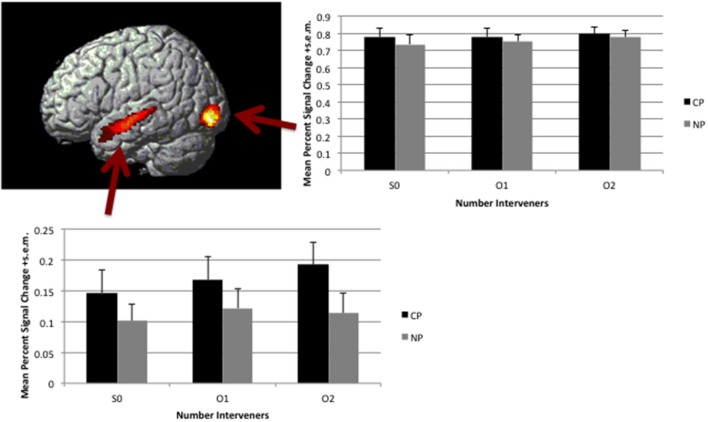
Figure 6.
Main effect of Type (CP>NP). Map is thresholded at voxel-wise p < 0.005 and corrected for multiple comparison through cluster size p < 0.05. Activation is overlaid on a rendered surface of the brain. The histogram to the right presents the mean percent signal change +s.e.m. over the entire Inferior Occipital Gyrus cluster broken down by condition (percent signal change was calculated in Marsbar per subject). The histogram below presents the mean percent signal change +s.e.m. over the entire Superior Temporal Sulcus cluster broken down by condition (percent signal change was calculated in Marsbar per subject).

