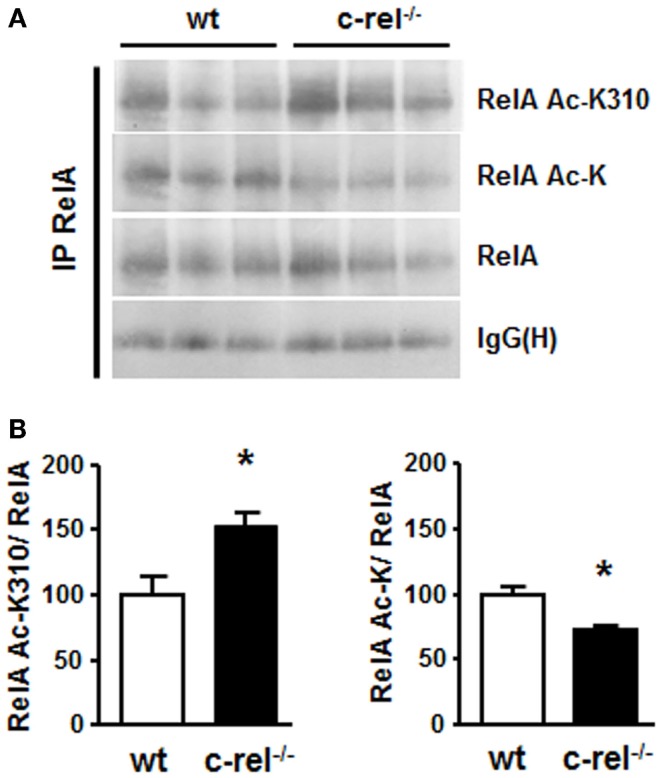
Figure 2.
RelA acetylation in the striatum of c-rel−/− and wt mice. (A) Representative picture of the immunoprecipitation analysis of RelA acetylation in total proteins of caudatus putamen. RelA acetylation at K310 residue increased, while total RelA acetylation was reduced in striatal total extracts of 18-month-old c-rel−/− mice. No significant change was detected in the total RelA content. (B) Values from densitometry analysis of immunoblots are expressed as a percentage of the wt value. The signal given by IgG(H) is used as a control for the quality of the immunoprecipitation. Bars depict the mean ± SEM (n = 4 animals per group), *p < 0.01 versus wt value.

