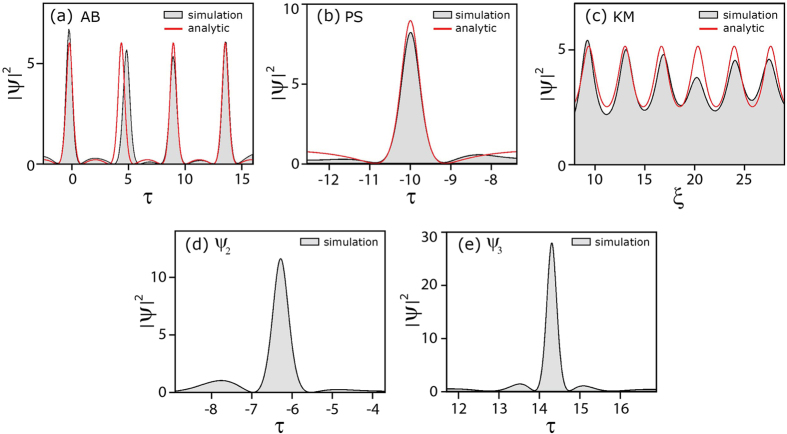
Figure 3.
The gray shaded plots in (a,b,c) show the intensity profiles extracted from the regions of the chaotic MI field indicated in Fig. 2 for an AB, PS, KM respectively, compared with analytical NLSE solutions (red solid line). In (d) and (e) we show the intensity profiles extracted from the regions of the chaotic MI field indicated in Fig. 2 for a second-order superposition ψ2 and third-order superposition ψ3.

