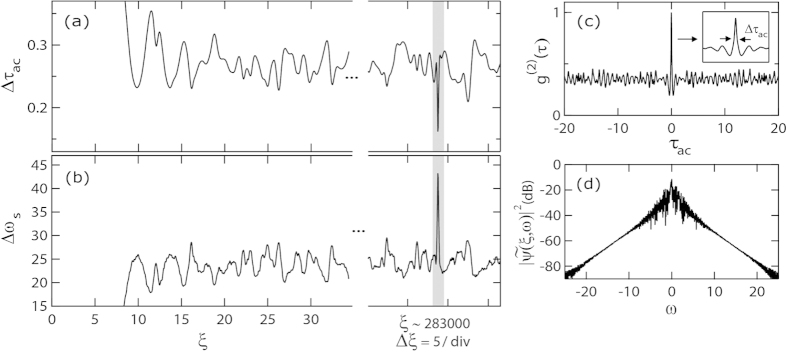
Figure 5.

As a function of the propagation distance ξ, Figs 5(a) and (b) plot the evolution of the width of the autocorrelation coherence peak and the −80 dB spectral width for the evolving MI field in Fig. 2. These results illustrate how spectral expansion is associated with the appearance of shorter temporal structures in the random AB pulse train. Figs 5(c) and (d) show the autocorrelation and spectrum for the highest intensity peak associated with the collision between three breathers. The detail in (c) shows how the FWHM of the central autocorrelation coherence peak is determined.
