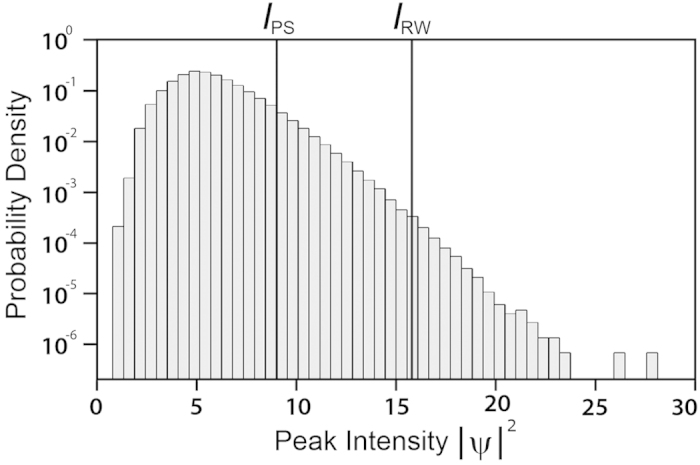
Figure 6.

Peak intensity statistics obtained using specific peak detection over a full two-dimensional spatio-temporal computational window. The lines indicate the Peregrine soliton threshold IPS
 and the rogue intensity threshold IRW (see text).

Peak intensity statistics obtained using specific peak detection over a full two-dimensional spatio-temporal computational window. The lines indicate the Peregrine soliton threshold IPS
 and the rogue intensity threshold IRW (see text).