Figure 2.

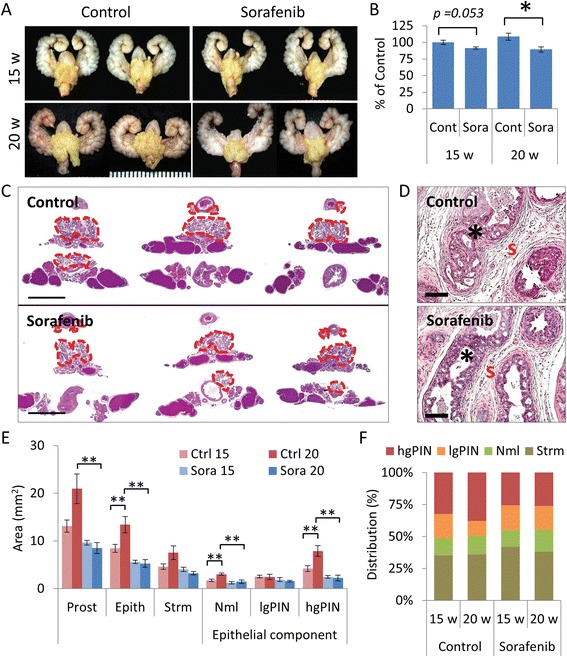
Chemopreventive effects of sorafenib on mouse PTEN-deficient prostate hgPIN. Six-week-old PTEN-deficient mice were treated with sorafenib (30 mg/kg 3X/week for nine or 14 weeks, n = 8 mice/group). (A) Representative GUTs from mice after indicated treatment. Prostate tumors are highlighted in yellow. Scale is represented in mm. (B) Plots of tumor burden assessed by GUT weight and expressed as the mean ± s.e., *P < 0.05. (C) Representative H&E stained tissue sections from mice after indicated treatment. Prostate tumors are delineated by the red dotted line. Scale bars represent 5 mm. (D) High magnification images of representative H&E stained tissue sections from mice after indicated treatment. Morphological differences in dysplastic glands (*) and stroma (s) are shown. Scale bars represent 100 μm. (E) Plots of absolute tumor tissue distribution analysis expressed as the mean ± s.e., * P < 0.05, **P < 0.01. (F) Plots of relative tumor tissue distribution analysis expressed as the percent of tumor involvement.
