Figure 5.

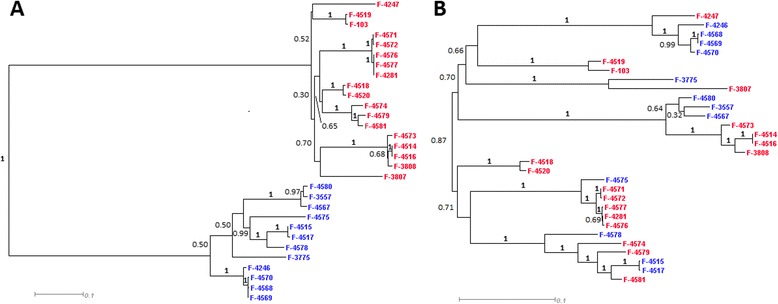
Phylogenetic configuration inside MAT-locus (A) compared to flanking regions (B). Strains with MAT-1 locus are marked with red, strains with MAT-2 locus are marked in blue. Bootstrap values calculated from 1000 bootstrap iterations.

Phylogenetic configuration inside MAT-locus (A) compared to flanking regions (B). Strains with MAT-1 locus are marked with red, strains with MAT-2 locus are marked in blue. Bootstrap values calculated from 1000 bootstrap iterations.