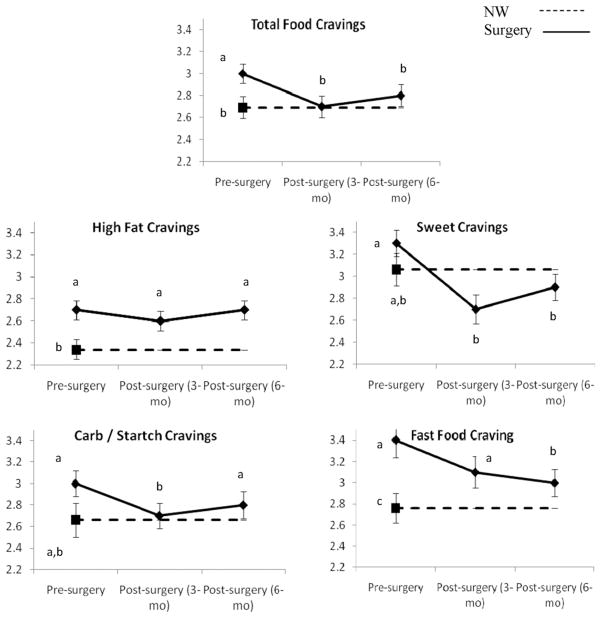
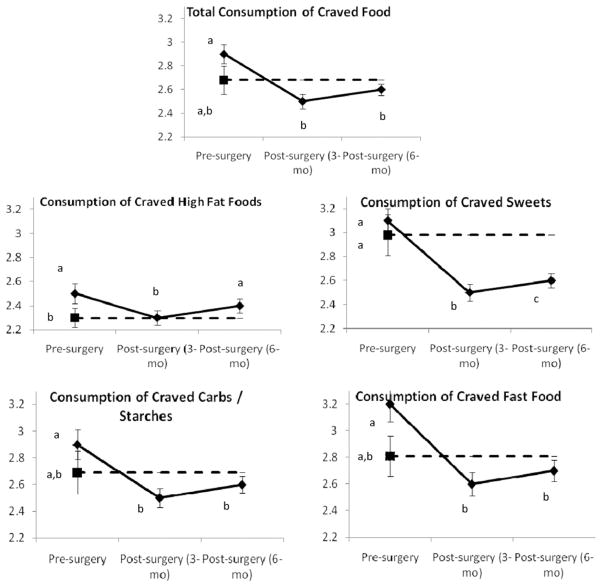
Fig. 1.
Frequency of food cravings and consumption of craved foods in bariatric surgery patients (solid line) measured preoperatively and 3 and 6 months postoperatively and NW controls (dashed line) measured at preoperative point. These data represent results from separate between-subject and within-subject analyses. For each dependent variable, data points with different labels (a, b, c) differ significantly from each other (P < .05). For example, in total food cravings, bariatric surgery patients had more frequent food cravings before surgery than at either postoperative point and compared with NW controls (a versus b). However, after surgery, patients did not differ from NW controls (shared b). Data points represent mean; error bars, standard error of mean.


