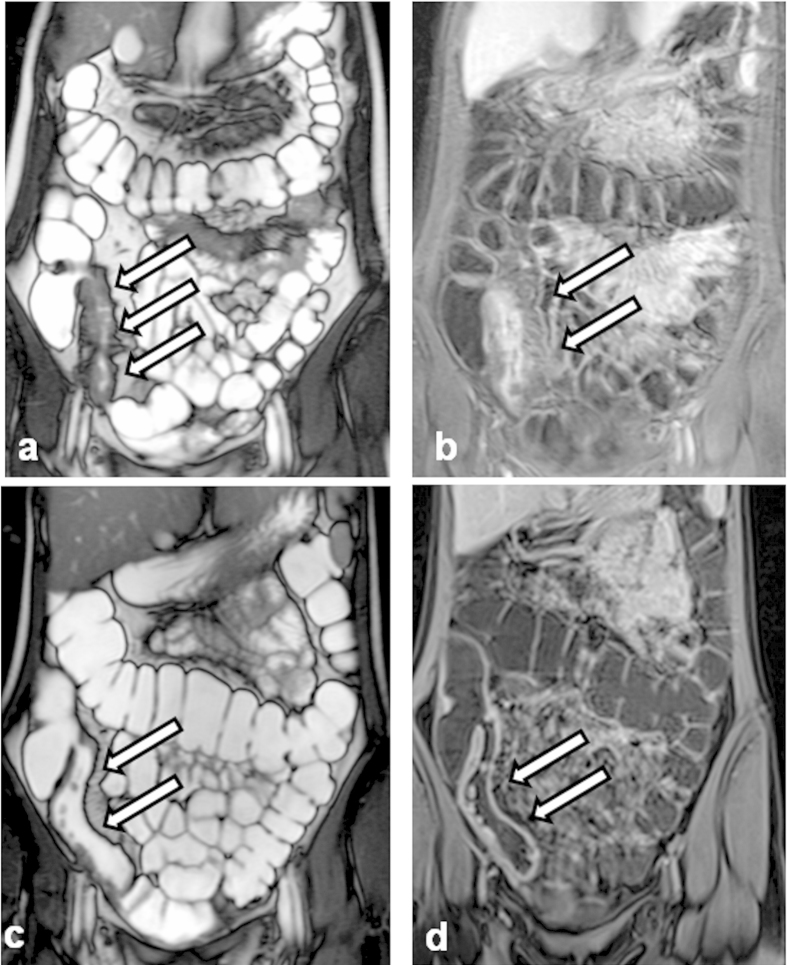
Figure 2.
Magnetic resonance enterography images illustrating an example of a response to one-year anti-tumor necrosis factor (anti-TNF) therapy in a patient with Crohn’s disease: (a) Week 0 - before anti-TNF therapy. T2-weighted sequence demonstrating thickening of a bowel wall (white arrows) without stenosis of the bowel lumen. (b) Week 0 - before anti-TNF therapy. Dynamic contrast enhanced T1-volume interpolated gradient-echo sequence demonstrating thickening of a bowel wall with enhancing in the various layers of the wall - hyperintense signal corresponding to edema in acute inflammation (white arrows). (c) Week 52. T2-weighted sequence demonstrating decrease of thickening of the bowel wall (white arrows) after one-year anti-TNF therapy. (d) Week 52. Dynamic contrast enhanced T1-volume interpolated gradient-echo sequence demonstrating decrease of thickening of the bowel wall with moderate enhancement typical for moderate activity of inflammation (white arrows) - after one-year anti-TNF therapy.

