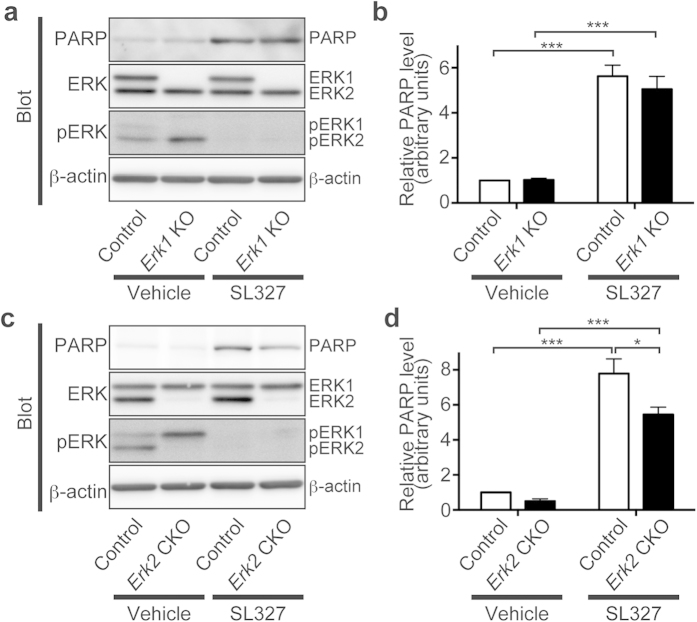
Figure 12. Blockade of both ERK isoforms was needed to induce apoptosis at P6.
(a) Representative images of western blot analysis investigating the effect of SL327 administration at P6 in Erk1 KO mice. (b) No significant difference was observed in the effect of SL327 administration on cleaved PARP levels in Erk1 KO mice compared with those of controls (Erk1 KO mice (SL327): n = 4, controls (SL327): n = 6). There was no significant difference on basal levels of cleaved PARP between Erk1 KO mice and controls (Erk1 KO mice (vehicle): n = 5, controls (vehicle): n = 5). (c) Representative images of western blot analysis investigating the effect of SL327 administration at P6 in Erk2 CKO mice. (d) Cleaved PARP levels caused by SL327 administration at P6 were significantly lower in Erk2 CKO mice compared with those of controls (Erk2 CKO mice (SL327): n = 6, controls (SL327): n = 6). There was no significant difference in basal apoptosis levels between Erk2 CKO mice and controls (Erk2 CKO mice (vehicle): n = 5, controls (vehicle): n = 5). To evaluate the expression and phosphorylation, band levels were divided by their corresponding loading internal control (β-actin). All the gels were run under the same experimental conditions. Cropped blots are shown in western blot data. Data are represented as mean ± SEM. *P < 0.05; ***P < 0.001.

