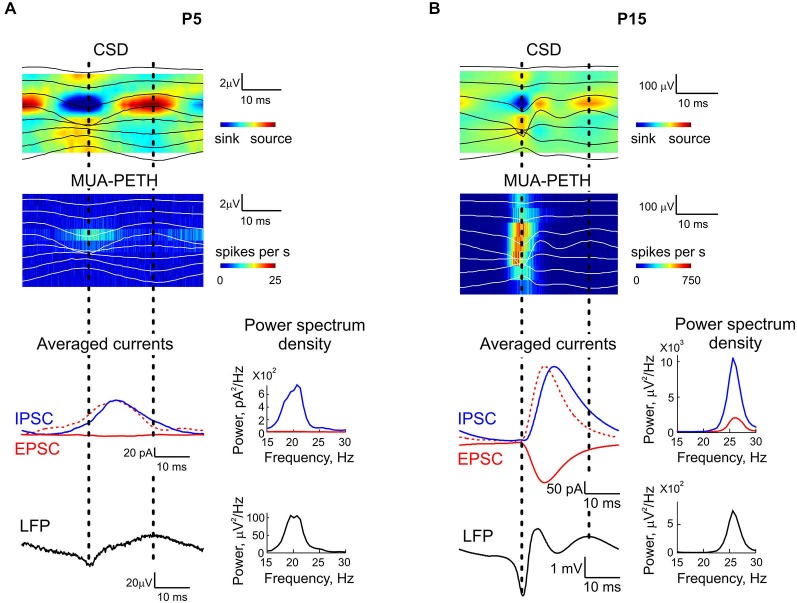
Figure 7.
IPSCs and EPSCs in relation to KA-Os cycles. Representative cases of CSD and MUA-PETH averaged by KA-Os troughs in pyramidal cell layer with corresponding averaged IPSCs (blue line) and EPSCs (red solid line) recorded from CA3 pyramidal cells in a P5 (A) and P15 (B) rat hippocampal slices. Red dashed lines show inverted EPSCs scaled to the peak IPSC amplitude. Note a few milliseconds delay of IPSCs from EPSCs. Corresponding power spectrum densities of IPSC, EPSC and LFP are shown on the right.

