Figure 8.
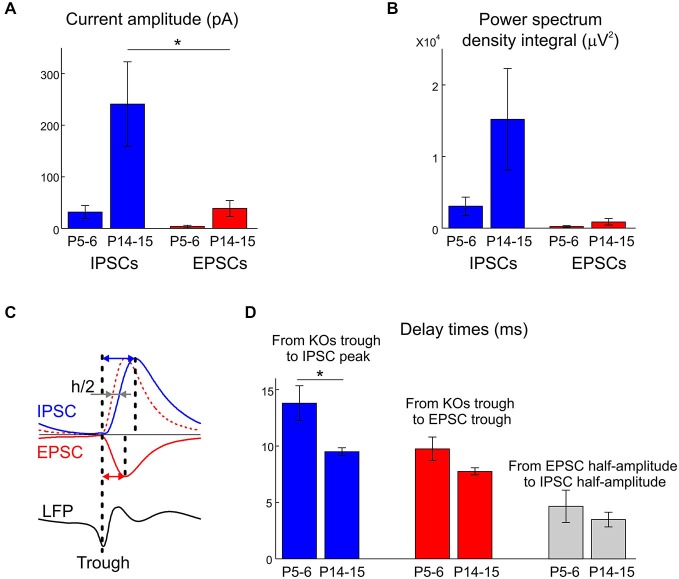
Group data statistics on the developmental changes in synaptic contributions to KA-Os. (A) Amplitudes of IPSCs and EPSCs averaged by KA-Os’ troughs in P5–6 and P14–15 age groups. (B) PSD integrals of IPSCs and EPSCs within the KA-Os frequency band in the two age groups. (C) Calculation of delays. Blue and red arrows show the times from the KA-Os troughs to IPSCs and EPSCs peaks; grey arrows show half-rise time delay between EPSCs and IPSCs. (D) Summary of the developmental changes in delays measured as shown on panel (C). (A–D) Pooled data from 12 cells. Error bars indicate SE.

