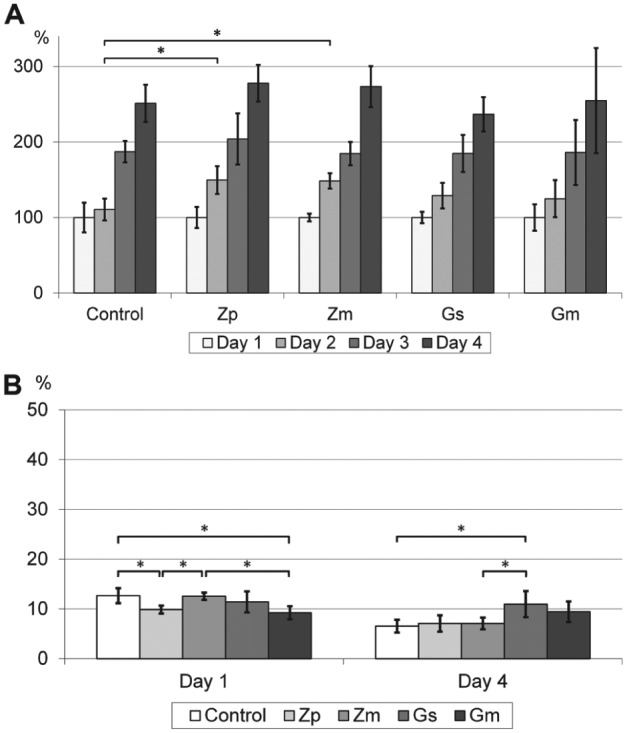
Figure 4.

Normalized proliferation (A) and cytotoxicity (B) of L929 mouse fibroblasts. Control, cell culture glass; Zp, polished Y-TZP; Zm, microstructured Y-TZP; Gs, smooth glass coatings (PC-XG3); Gm, microstructured glass coatings (PC-XG3). Means and standard deviations are shown (n = 6). *Significant difference, analyzed using the Tukey post hoc test (P < 0.05).
