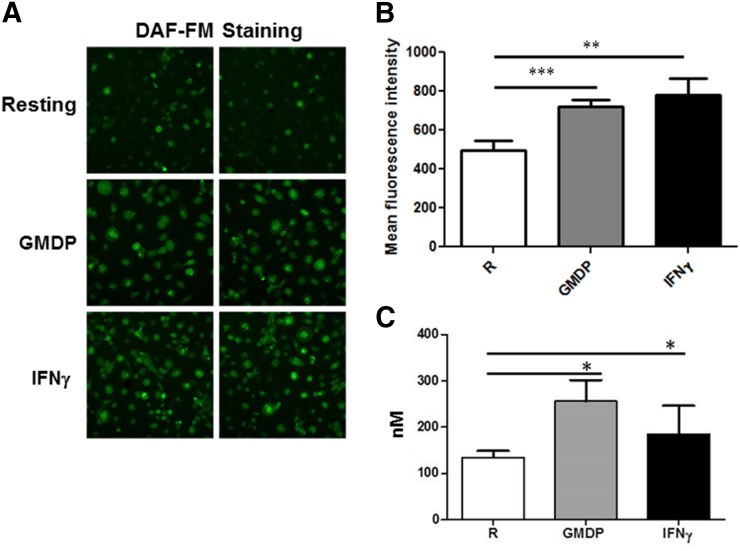
Figure 2. NOD2 agonists induce NO production in human macrophages.
Day 5 MDM monolayers on coverslips were treated with GMDP or IFN-γ for 24 h, and then cells were incubated with DAF-FM diacetate in RPMI containing phenol red-free for 30 min. Cells were washed 3 times with warm RPMI containing phenol red-free and then allowed to sit for 15 min for de-esterification to occur. Next, cells were fixed, mounted on slides, and examined by confocal microscopy with excitation/emission maxima of 495/515 nm (Olympus FluoView FV1000). (A) Two representative micrographs (40×) are shown of DAF-FM diacetate staining for each test group of 3 independent experiments performed on duplicate coverslips. (B) MFI of macrophages (150–300)/test group was calculated by use of Olympus FluoView FV1000 software. (C) The amount nitrite produced during GMDP- and IFN-γ-treated MDMs was determined by the DAN assay. Day 5 MDMs were washed and replenished with RPMI media without phenol red and subsequently incubated with GMDP or IFN-γ for 24 h, and the culture supernatants were centrifuged to remove all cell debris. The cell-free culture supernatants were used to determine the level of nitrite produced. (B and C) Cumulative data of the MFIs for each test group obtained from 3 independent experiments (mean ± sem; *P < 0.05; **P < 0.005; ***P < 0.0005).

