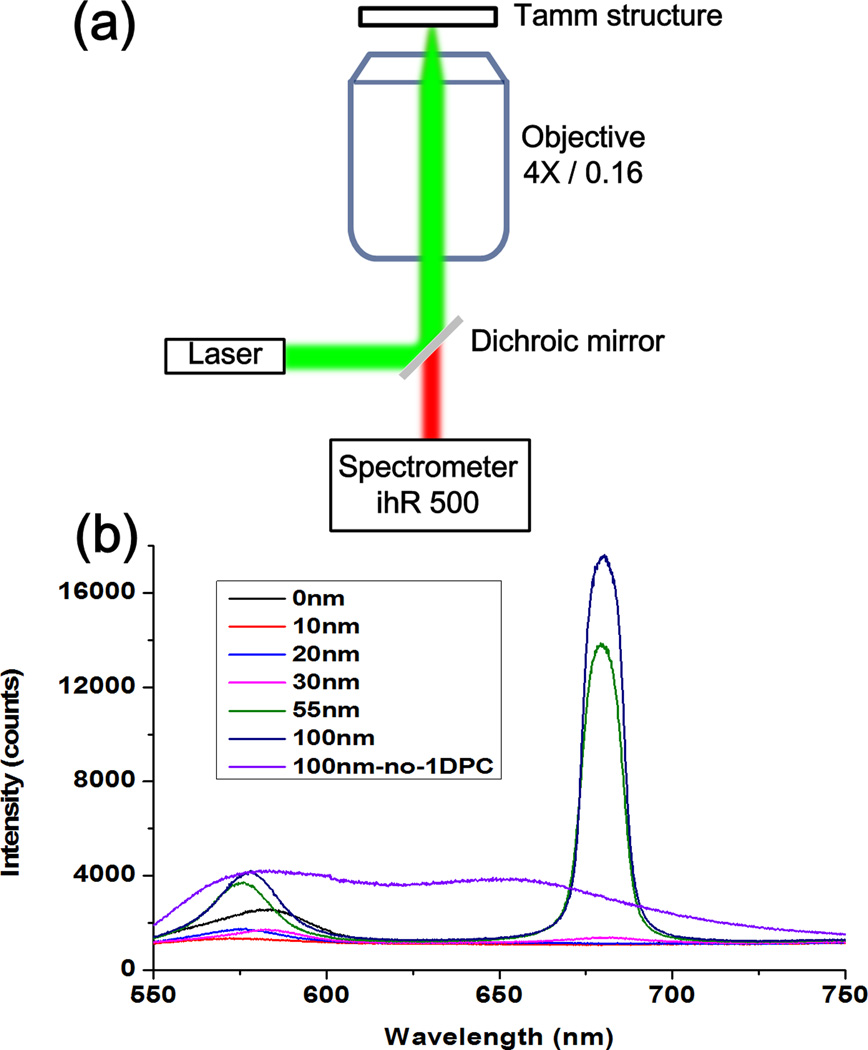
Figure 4.
(a) Schematic of the experimental set-up used to measure the TPCE spectra from the Tamm structures shown in Figure 1. An objective with low N.A of 0.16 is used to colleced the fluorescence emission normal to the surface of the Tamm substrates. Panel (b) shows the measured NB fluorecence spectra from the Tamm structures with varied top Ag layers thicknesses (0, 10, 20, 30, 55, and 100 nm). The fluorescence spectrum of a control sample without the 1DPC (Glass- 49 nm thick NB/PMMA- 100 nm thick Ag film ) is also measured (100 nm-no-1DPC), which shows broad emission band.

