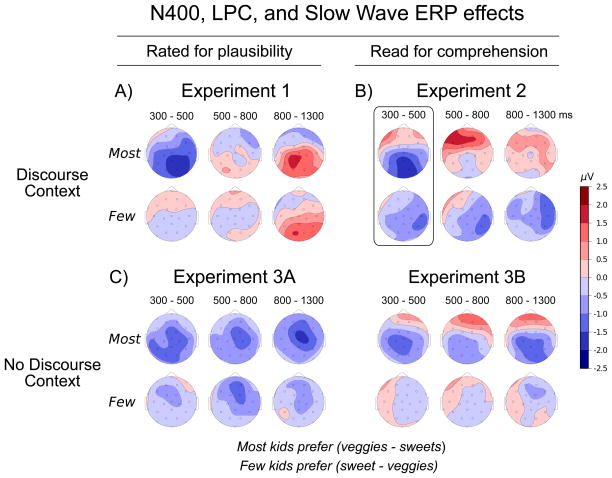
Figure 4. Spline-interpolated scalp distribution plots of N400 (300–500ms), LPC (500–800ms) and Slow Wave (800–1300ms) ERP amplitude effects.
Panel A) Experiment 1 (N = 16) with quantified sentences presented following supporting discourse and rated for plausibility. Panel B) Experiment 2 (N = 16) with the same quantified sentences and discourse contexts read for comprehension. Panel C) Control experiments with the quantified sentences only presented without the discourse contexts and rated for plausibility in Experiment 3A (left column, N = 16) or read for comprehension in Experiment 3B (right column, N = 16). For the most-type quantifiers, negative values 300–500ms poststimulus indicate greater N400 amplitude for atypical - typical words, i.e., the canonical typicality effect (Criterion 1). Note: For the few-type quantifiers, the typicality effect calculation is reversed so negative values 300–500ms indicate a reversal of the canonical typicality effect, i.e., satisfaction of Criterion 4. Contour lines indicate 0.5μV intervals.

