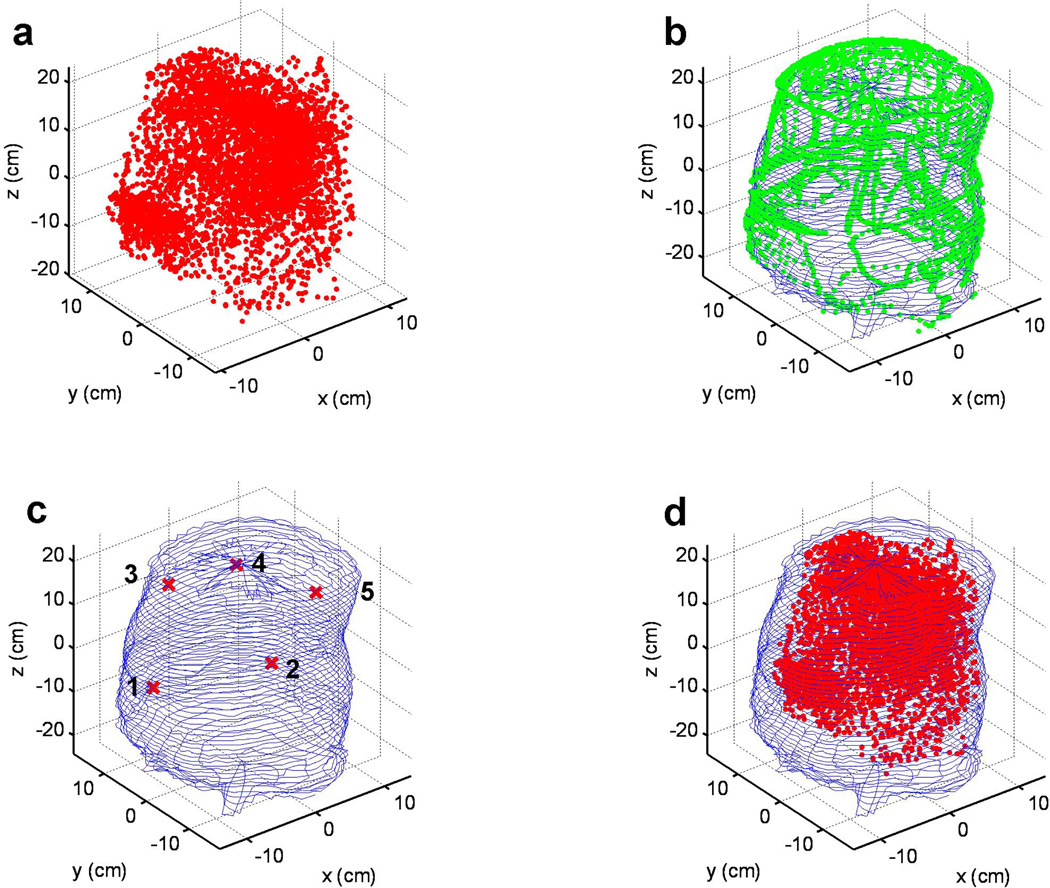
Figure 8.
(a) Laser point positions during a PDT treatment session in a phantom. (b) Overlay of surface contour determined by the reconstruction algorithm (thin blue line) and the raw IR camera data (green symbols). (c) The locations of the isotropic detectors on the phantom surface (thin blue lines). (d). Laser position (red symbol) within the phantom contour (thin blue lines).

