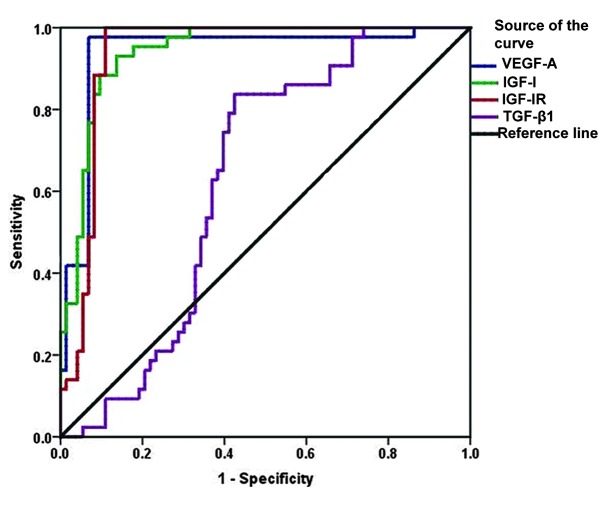
Figure 2.
ROC curve analysis for markers in triple-negative compared with non-triple-negative and normal control to calculate the optimal cut-off value. ROC, receiver operating characteristic; VEGF-A, vascular endothelial growth factor-A; IGF-I, insulin-like growth factor I; IGF-IR, IGF-I receptor; TGF-β1, transforming growth factor-β1.

